
Check your SQL
Recently I've been digging into an internal API for one of our customers because there were some complaints about the performance. Some, and only some, calls would take over 10 seconds to complete. These were all calls that were being used by XHR requests fetching data for display, and the users were (rightfully so) getting annoyed by some pages taking so long to load.
The API itself is, for performance reasons, very low on framework-y stuff. There's a basic request/response handling layer, but beneath that there's basically raw SQL being fed to PDO. If you ask me, this was a great choice. And since the underlying (MySQL) database has some tables with quite a lot of data, I immediately expected the queries on that data to be the problem. So the first thing I did was check the queries that would fetch the data to be returned. But those queries were not really a problem. They were pretty optimized, even if they would fetch a lot of data through several joins. Performance of those queries was great. So that was not the problem. OK, so what could possible cause the problem then.
I decided to pull out Blackfire, a tool for profiling your code (and more). I've used Blackfire in the past to find the performance bottlenecks in the code I was working on and felt I needed to use the same here. That was a good decision.
After installing Blackfire in my local Docker setup (I used the PHP-SDK for the API) I sent my first request with Postman and when checking the function calls, the problem immediately became clear to me
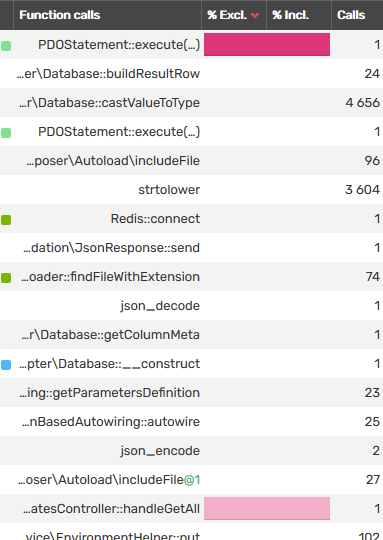
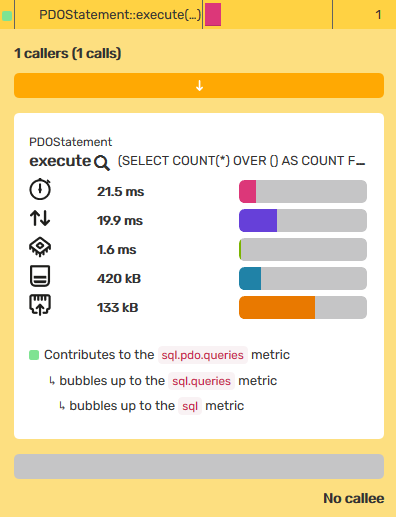
That's a whole lot of time for a single SQL query.
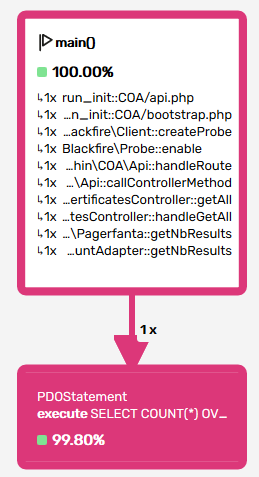
Oh, right. 99.8% of my full request is taken by... a COUNT query? OK, I had not expected that. I had assumed after testing the query that fetches the data that the count query would be OK too. I was wrong. What did people say about assumptions?
OK, so let's have a look at the query. There's a great little bit of functionality to figure out what the problem is, which is EXPLAIN. I took the COUNT query, added EXPLAIN in front of it, and checked what MySQL would tell me.
OK, the count query uses 2 where clauses and both fields have an index on them. However, a query only uses a single index. EXPLAIN told me which index, and also told me that using that index, it would have to go through about 20000 records to check whether the other WHERE clause matched or not. And it apparently took quite a bit of time to do that.
But it is possible to create an index on a combination of two fields. Now, you do have to be careful with creating too many indexes as your INSERT queries will get slower. It will have to be a conscious decision that balances the performance hits on both sides. But in this case, it made sense to add the index. And with effect.
LOOK! IT WORKED!
Optimizations in SQL
When you run into performance problems, there are often issues with different types of I/O. Whether it is file access, databases or external API's, those are common causes of performance. External API's are often things you can do little about (aside from caching). In terms of file access the main solution is "less file access". Save stuff in a Redis or Memcache or a similar memory-based solution. But in terms of SQL, it can be worth digging into your database schema and queries. There are many possible solutions. Take your time to have a good look at your SQL, and learn how to use the functions your database has to offer such as EXPLAIN to find the cause of your problems. Oh, and don't make assumptions like I did. Use tools like Blackfire to quickly find the cause of the problem. It'll make your life a lot easier and your work more efficient.